ethnicity_plot <- ggplot(
ethnicity_prizes_plot_data,
aes(x = prize_institution, y = prop, fill = ethnicity_macro)
) +
geom_col(width = 0.75) +
geom_text(
aes(label = label_display),
position = position_stack(vjust = 0.5),
size = 3.5,
color = "black",
na.rm = TRUE
) +
geom_text(
data = ethnicity_totals,
inherit.aes = FALSE,
aes(
x = prize_institution,
y = 1,
label = paste0(" (n = ", total_nominees, ")")
),
size = 3.5,
hjust = 0,
vjust = 0.5,
color = "grey40",
na.rm = TRUE
) +
coord_flip(clip = "off") +
scale_fill_manual(
values = palette_used,
breaks = present_levels,
name = "Ethnicity",
guide = guide_legend(
title.position = "top",
title.hjust = 0.5,
nrow = 1,
byrow = TRUE,
override.aes = list(size = 4)
)
) +
scale_y_continuous(
labels = percent,
breaks = c(0, 0.25, 0.5, 0.75, 1),
expand = expansion(mult = c(0, 0))
) +
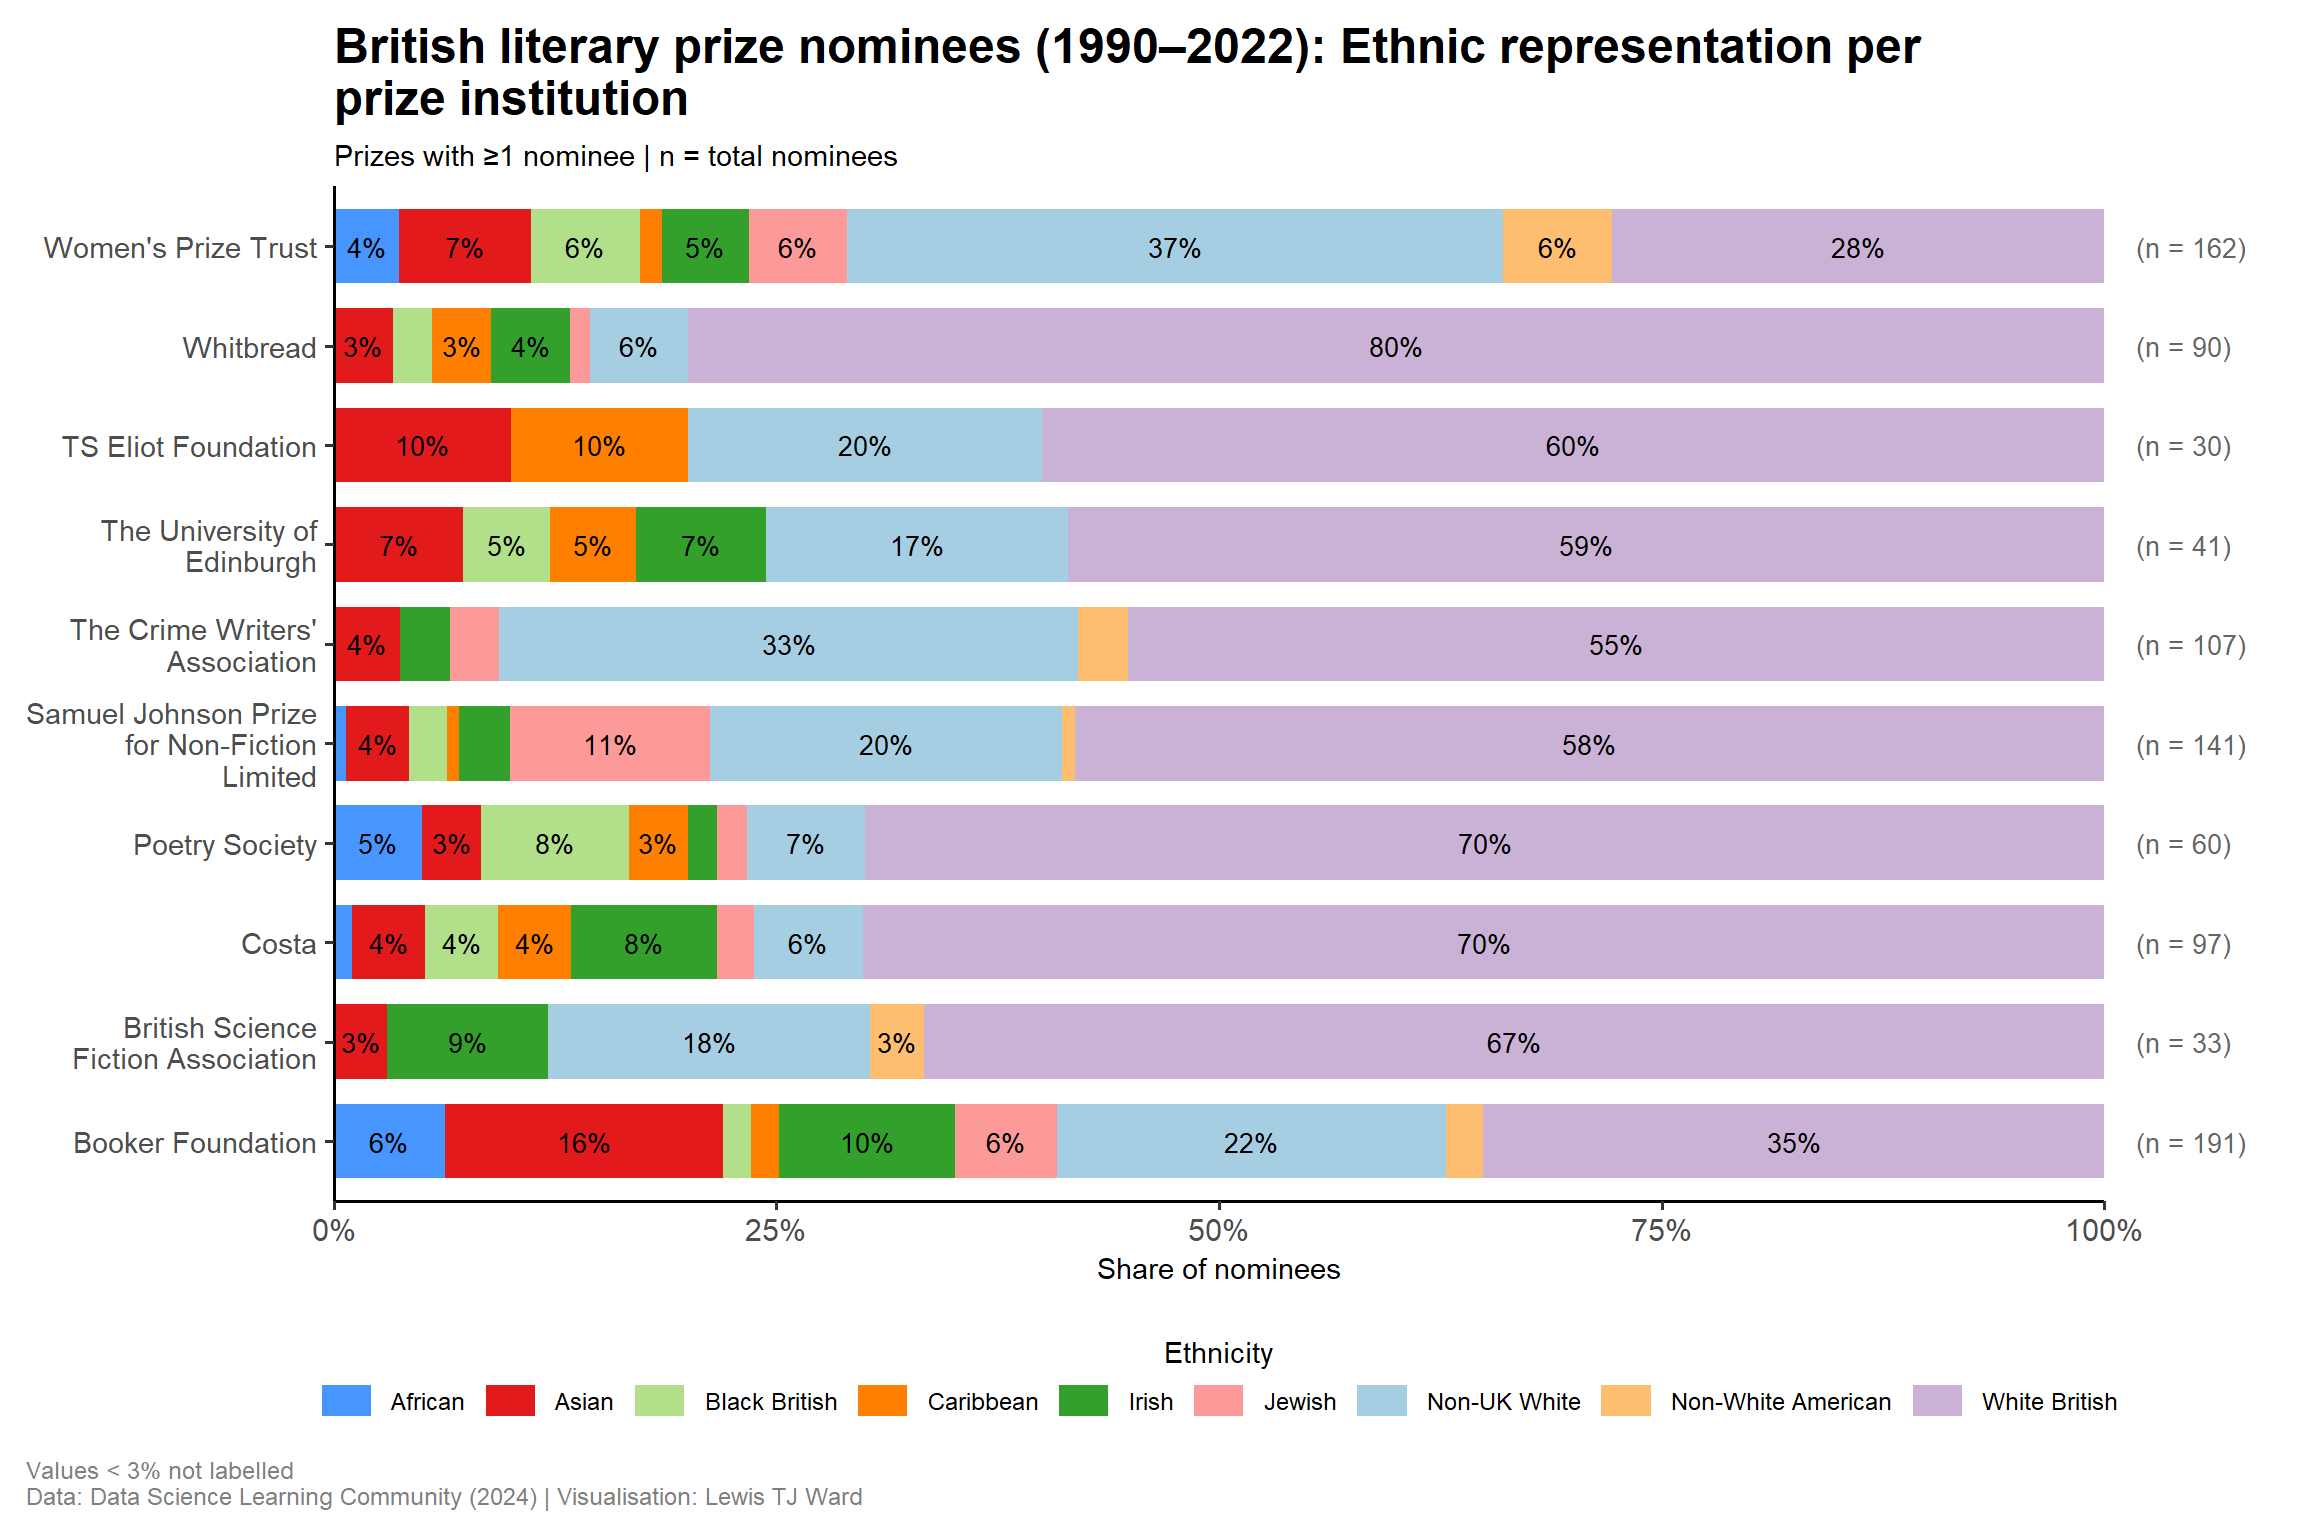
labs(
title = str_wrap(
"British literary prize nominees (1990–2022): Ethnic representation per prize institution",
70
),
subtitle = "Prizes with ≥1 nominee | n = total nominees",
x = NULL,
y = "Share of nominees",
caption = "Values < 3% not labelled\nData: Data Science Learning Community (2024) | Visualisation: Lewis TJ Ward"
) +
theme_tt() +
theme(
legend.title = element_text(size = 11, face = "plain", hjust = 0.5),
legend.text = element_text(size = 9),
legend.key.width = unit(0.7, "cm"),
legend.key.height = unit(0.45, "cm"),
legend.spacing.x = unit(0.12, "cm"),
legend.margin = margin(t = 6, b = 6),
legend.box = "horizontal",
legend.box.just = "center"
)
ggsave(
here("years", "2025", "43", "output", "ethnicity_representation_plot.png"),
plot = ethnicity_plot,
width = 12,
height = 8,
dpi = 300
)
ethnicity_plot